
【实践】WINDOWS下GOlang性能测试分析工具PProf&GO torch入门指导
匿名 · 更新于 2023/9/9
1.摘要
本文讲解在Windows 10操作系统VS Code集成环境下,如何使用GO语言的PProf工具进行性能分析和查看的基本操作,同时也介绍火焰图呈现GO torch的使用入门指导。
这篇文章比较长,应该是目前PProf&GO torch整理最全的一篇了,把纲要在摘要处先列一下,各位客官各取所需。
2,介绍和环境准备
2.1 PProf介绍
2.2 图形呈现辅助工具Graphviz
2.3 GO样例
3,通过WEB运行分析
4. 通过交互式终端分析
4.1 时长为60s的CPU占用分析
4.2 heap堆分析
4.3 stack栈分析
4.4 其他
5. PProf 可视化界面
6. go-torch火焰图生成工具
6.1 安装go-torch
6.2 下载安装 Perl ,用于执行 .pl 文件
6.3 生成并分析火焰图
7. 高性能程序建议
8.参考
复制2,介绍和环境准备
2.1 PProf介绍
go的pprof工具可以用来监测进程的运行数据,用于监控程序的性能,对内存使用和CPU使用的情况统信息进行分析。 官方提供了两个包:runtime/pprof和net/http/pprof,前者用于普通代码的性能分析,后者用于web服务器的性能分析。 PProf不需要独立安装,Go环境装好后即可引用启动了。
2.1.1 PProf功能
PProf工具可以做以下分析:
- CPU Profiling:CPU 分析,按照一定的频率采集所监听的应用程序 CPU(含寄存器)的使用情况,可确定应用程序在主动消耗 CPU 周期时花费时间的位置;
- Memory Profiling:内存分析,在应用程序进行堆分配时记录堆栈跟踪,用于监视当前和历史内存使用情况,以及检查内存泄漏;
- Block Profiling:阻塞分析,记录 goroutine 阻塞等待同步(包括定时器通道)的位置;
- Mutex Profiling:互斥锁分析,报告互斥锁的竞争情况;
2.2 图形呈现辅助工具Graphviz
Graphviz (英文:Graph Visualization Software的缩写)是一个由AT&T实验室启动的开源工具包,用于绘制DOT语言脚本描述的图形。它也提供了供其它软件使用的函式库。 需要图形化呈现PProf的分析结果,就需要安装Graphviz工具包。
2.2.1 下载安装包并安装
在官网目录下下载windows的安装包,并按照默认配置完成安装。 https://graphviz.gitlab.io/_pages/Download/Download_windows.html
2.2.2 配置环境变量
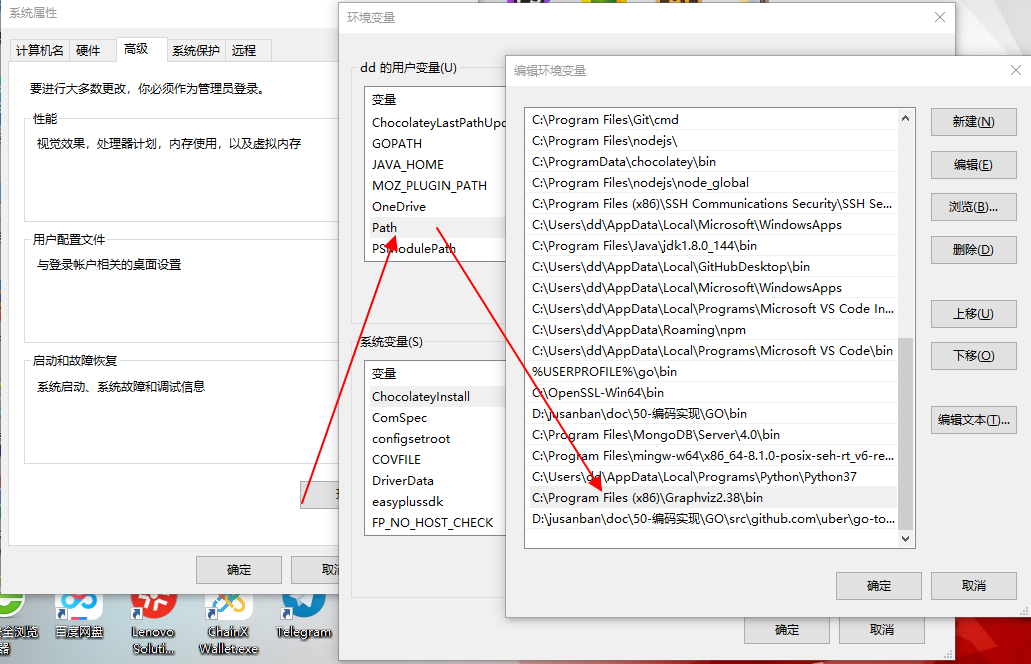
将graphviz安装目录下的bin文件夹添加到Path环境变量中:
C:\Program Files (x86)\Graphviz2.38\bin
操作如下图:
2.2.3 验证安装成功
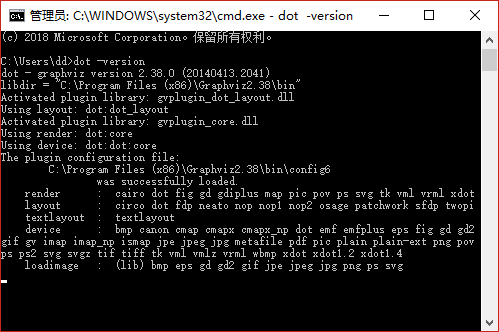
进入windows命令行界面,输入显示版本命令,如果显示graphviz的相关版本信息,则安装配置成功。
dot -version
操作如下图:
2.3 GO样例
(1) demo.go主程序
位置:$GOPATH\src\pprofDemo\demo.go
package main
import (
"log"
"net/http"
_ "net/http/pprof"
"pprofDemo/data"
)
func main() {
go func() {
for {
log.Println(data.Add("Hello World"))
}
}()
http<span class="token punctuation" style="box-sizing: border-box; list-style: inherit;">.</span><span class="token function" style="box-sizing: border-box; list-style: inherit; color: rgb(240, 141, 73);">ListenAndServe</span><span class="token punctuation" style="box-sizing: border-box; list-style: inherit;">(</span><span class="token string" style="box-sizing: border-box; list-style: inherit; color: rgb(126, 198, 153);">"0.0.0.0:6060"</span><span class="token punctuation" style="box-sizing: border-box; list-style: inherit;">,</span> nil<span class="token punctuation" style="box-sizing: border-box; list-style: inherit;">)</span>
}
复制(2) d.go
位置:$GOPATH\src\pprofDemo\data\demo.go
package data
var datas []string
func Add(str string) string {
data := []byte(str)
sData := string(data)
datas = append(datas, sData)
<span class="token keyword" style="box-sizing: border-box; list-style: inherit; color: rgb(204, 153, 205);">return</span> sData

}
复制(3) 运行GO程序
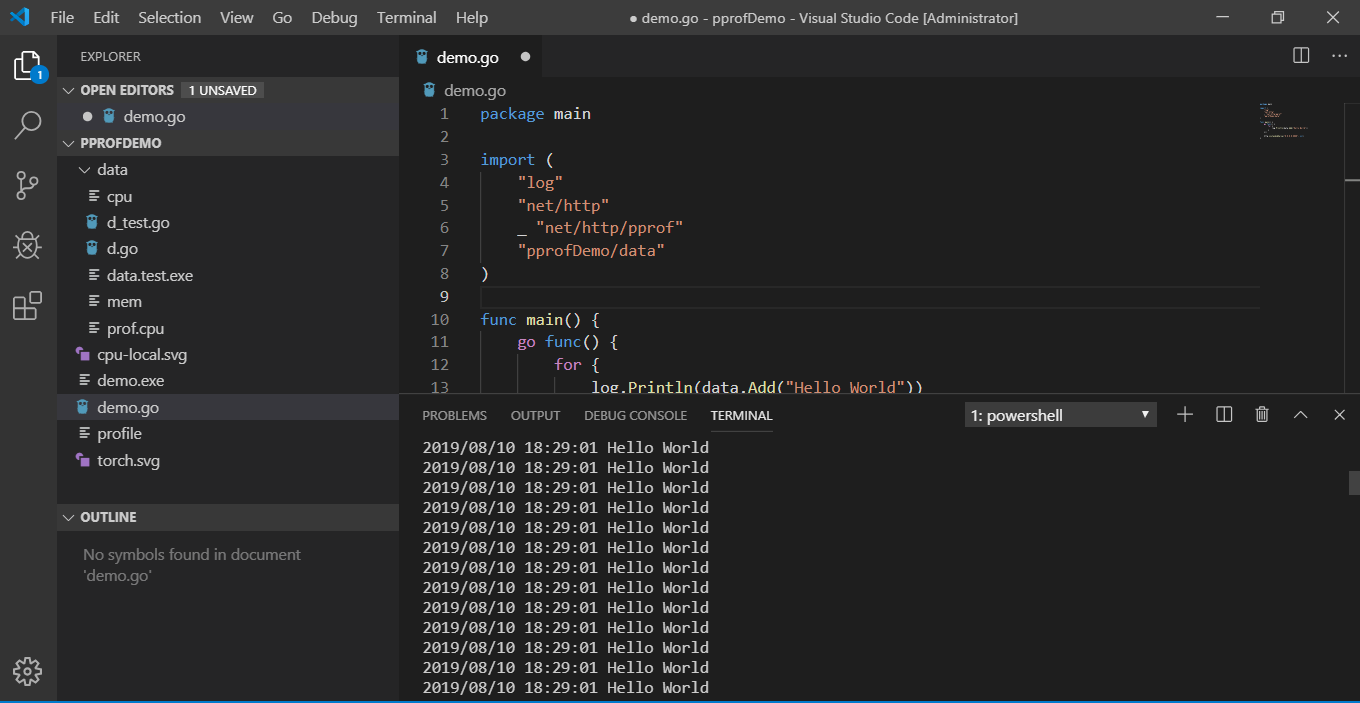
在Windows的CMD命令行或者VS Code的终端命令行运行程序:
go run demo.go
程序结果:
3,通过WEB运行分析
在浏览器下输入以下地址运行PProf分析:
浏览器可呈现以下内容:
/debug/pprof/
Types of profiles available:
| Count | Profile |
| --- | --- |
| 17 | [allocs](http://127.0.0.1:6060/debug/pprof/allocs?debug=1) |
| 0 | [block](http://127.0.0.1:6060/debug/pprof/block?debug=1) |
| 0 | [cmdline](http://127.0.0.1:6060/debug/pprof/cmdline) |
| 5 | [goroutine](http://127.0.0.1:6060/debug/pprof/goroutine?debug=1) |
| 17 | [heap](http://127.0.0.1:6060/debug/pprof/heap?debug=1) |
| 0 | [mutex](http://127.0.0.1:6060/debug/pprof/mutex?debug=1) |
| 0 | [profile](http://127.0.0.1:6060/debug/pprof/profile) |
| 7 | [threadcreate](http://127.0.0.1:6060/debug/pprof/threadcreate?debug=1) |
| 0 | [trace](http://127.0.0.1:6060/debug/pprof/trace) |
[full goroutine stack dump](http://127.0.0.1:6060/debug/pprof/goroutine?debug=2)
Profile Descriptions:
   allocs:
A sampling of all past memory allocations
   block:
Stack traces that led to blocking on synchronization primitives
   cmdline:
The command line invocation of the current program
   goroutine:
Stack traces of all current goroutines
   heap:
A sampling of memory allocations of live objects. You can specify the gc GET parameter to run GC before taking the heap sample.
   mutex:
Stack traces of holders of contended mutexes
   profile:
CPU profile. You can specify the duration in the seconds GET parameter. After you get the profile file, use the go tool pprof command to investigate the profile.
   threadcreate:
Stack traces that led to the creation of new OS threads
*   trace:
A trace of execution of the current program. You can specify the duration in the seconds GET parameter. After you get the trace file, use the go tool trace command to investigate the trace.
复制【说明】 debug=1时,会将函数地址转换为函数名,即脱离 pprof 在浏览器中直接查看。 对 goroutine CMD来说,还支持 debug=2,此时将以 unrecovered panic 的格式打印堆栈,可读性更高。
3.1 alloc - 内存分配情况
点击第一个链接 allocs 可以看到内容分配情况。
输出样例:
heap profile: 98: 122078816 [707: 334820144] @ heap/1048576
1: 67821568 [1: 67821568] @ 0x729d16 0x729c35 0x45cb31
#   0x729d15    pprofDemo/data.Add+0x165    D:/jusanban/doc/50-编码实现/GO/src/pprofDemo/data/d.go:8
#   0x729c34    main.main.func1+0x84        D:/jusanban/doc/50-编码实现/GO/src/pprofDemo/demo.go:13
1: 54255616 [1: 54255616] @ 0x729d16 0x729c35 0x45cb31
0x729d15    pprofDemo/data.Add+0x165    D:/jusanban/doc/50-编码实现/GO/src/pprofDemo/data/d.go:8
0x729c34    main.main.func1+0x84        D:/jusanban/doc/50-编码实现/GO/src/pprofDemo/demo.go:13
94: 1504 [94: 1504] @ 0x729c83 0x729c35 0x45cb31
0x729c82    pprofDemo/data.Add+0xd2 D:/jusanban/doc/50-编码实现/GO/src/pprofDemo/data/d.go:7
0x729c34    main.main.func1+0x84    D:/jusanban/doc/50-编码实现/GO/src/pprofDemo/demo.go:13
2: 128 [386: 24704] @ 0x49c621 0x4c62dd 0x4c5c8c 0x4cbeb7 0x4cbe8a 0x4e4125 0x4e4e13 0x729c34 0x45cb31
0x49c620    unicode/utf16.Encode+0x70       C:/Go/src/unicode/utf16/utf16.go:64
0x4c62dc    internal/poll.(*FD).writeConsole+0x43c  C:/Go/src/internal/poll/fd_windows.go:732
0x4c5c8b    internal/poll.(*FD).Write+0x19b     C:/Go/src/internal/poll/fd_windows.go:676
0x4cbeb6    os.(*File).write+0x76           C:/Go/src/os/file_windows.go:224
0x4cbe89    os.(*File).Write+0x49           C:/Go/src/os/file.go:145
0x4e4124    log.(*Logger).Output+0x204      C:/Go/src/log/log.go:172
0x4e4e12    log.Println+0x72            C:/Go/src/log/log.go:308
0x729c33    main.main.func1+0x83            D:/jusanban/doc/50-编码实现/GO/src/pprofDemo/demo.go:13
0: 0 [0: 0] @ 0x729d16 0x729c35 0x45cb31
0x729d15    pprofDemo/data.Add+0x165    D:/jusanban/doc/50-编码实现/GO/src/pprofDemo/data/d.go:8
0x729c34    main.main.func1+0x84        D:/jusanban/doc/50-编码实现/GO/src/pprofDemo/demo.go:13
0: 0 [1: 27770880] @ 0x729d16 0x729c35 0x45cb31
0x729d15    pprofDemo/data.Add+0x165    D:/jusanban/doc/50-编码实现/GO/src/pprofDemo/data/d.go:8
0x729c34    main.main.func1+0x84        D:/jusanban/doc/50-编码实现/GO/src/pprofDemo/demo.go:13
0: 0 [1: 22216704] @ 0x729d16 0x729c35 0x45cb31
0x729d15    pprofDemo/data.Add+0x165    D:/jusanban/doc/50-编码实现/GO/src/pprofDemo/data/d.go:8
0x729c34    main.main.func1+0x84        D:/jusanban/doc/50-编码实现/GO/src/pprofDemo/demo.go:13
0: 0 [1: 17768448] @ 0x729d16 0x729c35 0x45cb31
0x729d15    pprofDemo/data.Add+0x165    D:/jusanban/doc/50-编码实现/GO/src/pprofDemo/data/d.go:8
0x729c34    main.main.func1+0x84        D:/jusanban/doc/50-编码实现/GO/src/pprofDemo/demo.go:13
0: 0 [1: 14213120] @ 0x729d16 0x729c35 0x45cb31
0x729d15    pprofDemo/data.Add+0x165    D:/jusanban/doc/50-编码实现/GO/src/pprofDemo/data/d.go:8
0x729c34    main.main.func1+0x84        D:/jusanban/doc/50-编码实现/GO/src/pprofDemo/demo.go:13
0: 0 [1: 11370496] @ 0x729d16 0x729c35 0x45cb31
0x729d15    pprofDemo/data.Add+0x165    D:/jusanban/doc/50-编码实现/GO/src/pprofDemo/data/d.go:8
0x729c34    main.main.func1+0x84        D:/jusanban/doc/50-编码实现/GO/src/pprofDemo/demo.go:13
0: 0 [1: 9093120] @ 0x729d16 0x729c35 0x45cb31
0x729d15    pprofDemo/data.Add+0x165    D:/jusanban/doc/50-编码实现/GO/src/pprofDemo/data/d.go:8
0x729c34    main.main.func1+0x84        D:/jusanban/doc/50-编码实现/GO/src/pprofDemo/demo.go:13
0: 0 [1: 7274496] @ 0x729d16 0x729c35 0x45cb31
0x729d15    pprofDemo/data.Add+0x165    D:/jusanban/doc/50-编码实现/GO/src/pprofDemo/data/d.go:8
0x729c34    main.main.func1+0x84        D:/jusanban/doc/50-编码实现/GO/src/pprofDemo/demo.go:13
0: 0 [1: 5816320] @ 0x729d16 0x729c35 0x45cb31
0x729d15    pprofDemo/data.Add+0x165    D:/jusanban/doc/50-编码实现/GO/src/pprofDemo/data/d.go:8
0x729c34    main.main.func1+0x84        D:/jusanban/doc/50-编码实现/GO/src/pprofDemo/demo.go:13
0: 0 [1: 4653056] @ 0x729d16 0x729c35 0x45cb31
0x729d15    pprofDemo/data.Add+0x165    D:/jusanban/doc/50-编码实现/GO/src/pprofDemo/data/d.go:8
0x729c34    main.main.func1+0x84        D:/jusanban/doc/50-编码实现/GO/src/pprofDemo/demo.go:13
0: 0 [1: 3719168] @ 0x729d16 0x729c35 0x45cb31
0x729d15    pprofDemo/data.Add+0x165    D:/jusanban/doc/50-编码实现/GO/src/pprofDemo/data/d.go:8
0x729c34    main.main.func1+0x84        D:/jusanban/doc/50-编码实现/GO/src/pprofDemo/demo.go:13
0: 0 [1: 2973696] @ 0x729d16 0x729c35 0x45cb31
0x729d15    pprofDemo/data.Add+0x165    D:/jusanban/doc/50-编码实现/GO/src/pprofDemo/data/d.go:8
0x729c34    main.main.func1+0x84        D:/jusanban/doc/50-编码实现/GO/src/pprofDemo/demo.go:13
0: 0 [1: 2375680] @ 0x729d16 0x729c35 0x45cb31
0x729d15    pprofDemo/data.Add+0x165    D:/jusanban/doc/50-编码实现/GO/src/pprofDemo/data/d.go:8
0x729c34    main.main.func1+0x84        D:/jusanban/doc/50-编码实现/GO/src/pprofDemo/demo.go:13
0: 0 [1: 1900544] @ 0x729d16 0x729c35 0x45cb31
0x729d15    pprofDemo/data.Add+0x165    D:/jusanban/doc/50-编码实现/GO/src/pprofDemo/data/d.go:8
0x729c34    main.main.func1+0x84        D:/jusanban/doc/50-编码实现/GO/src/pprofDemo/demo.go:13
0: 0 [1: 1515520] @ 0x729d16 0x729c35 0x45cb31
0x729d15    pprofDemo/data.Add+0x165    D:/jusanban/doc/50-编码实现/GO/src/pprofDemo/data/d.go:8
0x729c34    main.main.func1+0x84        D:/jusanban/doc/50-编码实现/GO/src/pprofDemo/demo.go:13
0: 0 [89: 1424] @ 0x729bf6 0x45cb31
0x729bf5    main.main.func1+0x45    D:/jusanban/doc/50-编码实现/GO/src/pprofDemo/demo.go:13
0: 0 [1: 34717696] @ 0x729d16 0x729c35 0x45cb31
0x729d15    pprofDemo/data.Add+0x165    D:/jusanban/doc/50-编码实现/GO/src/pprofDemo/data/d.go:8
0x729c34    main.main.func1+0x84        D:/jusanban/doc/50-编码实现/GO/src/pprofDemo/demo.go:13
0: 0 [1: 966656] @ 0x729d16 0x729c35 0x45cb31
0x729d15    pprofDemo/data.Add+0x165    D:/jusanban/doc/50-编码实现/GO/src/pprofDemo/data/d.go:8
0x729c34    main.main.func1+0x84        D:/jusanban/doc/50-编码实现/GO/src/pprofDemo/demo.go:13
0: 0 [1: 770048] @ 0x729d16 0x729c35 0x45cb31
0x729d15    pprofDemo/data.Add+0x165    D:/jusanban/doc/50-编码实现/GO/src/pprofDemo/data/d.go:8
0x729c34    main.main.func1+0x84        D:/jusanban/doc/50-编码实现/GO/src/pprofDemo/demo.go:13
0: 0 [1: 43401216] @ 0x729d16 0x729c35 0x45cb31
0x729d15    pprofDemo/data.Add+0x165    D:/jusanban/doc/50-编码实现/GO/src/pprofDemo/data/d.go:8
0x729c34    main.main.func1+0x84        D:/jusanban/doc/50-编码实现/GO/src/pprofDemo/demo.go:13
0: 0 [116: 1856] @ 0x4d5445 0x4e4de6 0x729c34 0x45cb31
0x4d5444    fmt.Sprintln+0x84   C:/Go/src/fmt/print.go:283
0x4e4de5    log.Println+0x45    C:/Go/src/log/log.go:308
0x729c33    main.main.func1+0x83    D:/jusanban/doc/50-编码实现/GO/src/pprofDemo/demo.go:13
0: 0 [1: 122880] @ 0x729d16 0x729c35 0x45cb31
0x729d15    pprofDemo/data.Add+0x165    D:/jusanban/doc/50-编码实现/GO/src/pprofDemo/data/d.go:8
0x729c34    main.main.func1+0x84        D:/jusanban/doc/50-编码实现/GO/src/pprofDemo/demo.go:13
0: 0 [1: 73728] @ 0x729d16 0x729c35 0x45cb31
0x729d15    pprofDemo/data.Add+0x165    D:/jusanban/doc/50-编码实现/GO/src/pprofDemo/data/d.go:8
0x729c34    main.main.func1+0x84        D:/jusanban/doc/50-编码实现/GO/src/pprofDemo/demo.go:13
runtime.MemStats
Alloc = 335946224
TotalAlloc = 1014013712
Sys = 473841272
Lookups = 0
Mallocs = 21077384
Frees = 12720394
HeapAlloc = 335946224
HeapSys = 448593920
HeapIdle = 111927296
HeapInuse = 336666624
HeapReleased = 111927296
HeapObjects = 8356990
Stack = 196608 / 196608
MSpan = 3232944 / 3260416
MCache = 6816 / 16384
BuckHashSys = 1448289
GCSys = 19006848
OtherSys = 1318807
NextGC = 441561264
LastGC = 1565433417148020100
PauseNs = [0 0 0 0 0 0 0 0 0 0 0 0 0 0 0 0 0 0 0 0 0 0 0 0 0 0 0 0 0 0 0 0 0 0 0 0 0 0 0 0 0 0 0 0 0 0 0 0 0 0 0 0 0 0 0 0 0 0 0 0 0 0 0 0 0 0 0 0 0 0 0 0 0 0 0 0 0 0 0 0 0 0 0 0 0 0 0 0 0 0 0 0 0 0 0 0 0 0 0 0 0 0 0 0 0 0 0 0 0 0 0 0 0 0 0 0 0 0 0 0 0 0 0 0 0 0 0 0 0 0 0 0 0 0 0 0 0 0 0 0 0 0 0 0 0 0 0 0 0 0 0 0 0 0 0 0 0 0 0 0 0 0 0 0 0 0 0 0 0 0 0 0 0 0 0 0 0 0 0 0 0 0 0 0 0 0 0 0 0 0 0 0 0 0 0 0 0 0 0 0 0 0 0 0 0 0 0 0 0 0 0 0 0 0 0 0 0 0 0 0 0 0 0 0 0 0 0 0 0 0 0 0 0 0 0 0 0 0 0 0 0 0 0 0 0 0 0 0 0 0 0 0 0 0 0 0]
PauseEnd = [1565433169073748700 1565433170816751000 1565433172159983400 1565433172945533000 1565433174099874000 1565433175518063100 1565433177619860000 1565433179975512400 1565433181864431500 1565433184265065100 1565433187523962900 1565433191149906300 1565433195655882800 1565433202544943300 1565433210091628000 1565433219576071700 1565433231443300400 1565433250042853500 1565433271147866600 1565433296270582800 1565433329182917200 1565433367374672600 1565433417148020100 0 0 0 0 0 0 0 0 0 0 0 0 0 0 0 0 0 0 0 0 0 0 0 0 0 0 0 0 0 0 0 0 0 0 0 0 0 0 0 0 0 0 0 0 0 0 0 0 0 0 0 0 0 0 0 0 0 0 0 0 0 0 0 0 0 0 0 0 0 0 0 0 0 0 0 0 0 0 0 0 0 0 0 0 0 0 0 0 0 0 0 0 0 0 0 0 0 0 0 0 0 0 0 0 0 0 0 0 0 0 0 0 0 0 0 0 0 0 0 0 0 0 0 0 0 0 0 0 0 0 0 0 0 0 0 0 0 0 0 0 0 0 0 0 0 0 0 0 0 0 0 0 0 0 0 0 0 0 0 0 0 0 0 0 0 0 0 0 0 0 0 0 0 0 0 0 0 0 0 0 0 0 0 0 0 0 0 0 0 0 0 0 0 0 0 0 0 0 0 0 0 0 0 0 0 0 0 0 0 0 0 0 0 0 0 0 0 0 0 0 0 0 0 0 0 0 0 0 0 0 0 0 0]
NumGC = 23
NumForcedGC = 0
GCCPUFraction = 0.0016365068582352524
DebugGC = false
复制
3.2 block - 导致阻塞同步的堆栈跟踪
点击第二个链接 0 | block获取导致阻塞的 goroutine 堆栈(如 channel, mutex 等)。
结果 - 不存在阻塞情况:
--- contention:
cycles/second=2181652749
复制3.3 cmdline - 当前程序激活的命令行
点击 0 | cmdline获得当前程序激活的命令行启动参数。
结果:
C:\Users\dd\AppData\Local\Temp\go-build574785414\b001\exe\demo.exe
复制3.4 goroutine - 当前运行的goroutine
点击 6 | goroutine 获得当前当前运行的goroutine的堆栈信息。
结果:
goroutine profile: total 5
1 @ 0x403e05 0x44ba7d 0x4a4096 0x4c620b 0x4c5c8c 0x4cbeb7 0x4cbe8a 0x4e4125 0x4e4e13 0x729c34 0x45cb31
#   0x44ba7c    syscall.Syscall6+0xec           C:/Go/src/runtime/syscall_windows.go:199
#   0x4a4095    syscall.WriteConsole+0xb5       C:/Go/src/syscall/zsyscall_windows.go:1297
#   0x4c620a    internal/poll.(*FD).writeConsole+0x36a  C:/Go/src/internal/poll/fd_windows.go:735
#   0x4c5c8b    internal/poll.(*FD).Write+0x19b     C:/Go/src/internal/poll/fd_windows.go:676
#   0x4cbeb6    os.(*File).write+0x76           C:/Go/src/os/file_windows.go:224
#   0x4cbe89    os.(*File).Write+0x49           C:/Go/src/os/file.go:145
#   0x4e4124    log.(*Logger).Output+0x204      C:/Go/src/log/log.go:172
#   0x4e4e12    log.Println+0x72            C:/Go/src/log/log.go:308
#   0x729c33    main.main.func1+0x83            D:/jusanban/doc/50-编码实现/GO/src/pprofDemo/demo.go:13
1 @ 0x431974 0x42b491 0x42aa0d 0x4c25c2 0x4c38a4 0x4c4edb 0x56f896 0x581e50 0x6938ae 0x61fa16 0x620744 0x62097b 0x623886 0x68dd14 0x68dd06 0x694baa 0x69901f 0x45cb31
0x42aa0c    internal/poll.runtime_pollWait+0x5c     C:/Go/src/runtime/netpoll.go:182
0x4c25c1    internal/poll.(*pollDesc).wait+0xa1     C:/Go/src/internal/poll/fd_poll_runtime.go:87
0x4c38a3    internal/poll.(*ioSrv).ExecIO+0x123     C:/Go/src/internal/poll/fd_windows.go:228
0x4c4eda    internal/poll.(*FD).Read+0x26a          C:/Go/src/internal/poll/fd_windows.go:502
0x56f895    net.(*netFD).Read+0x55              C:/Go/src/net/fd_windows.go:152
0x581e4f    net.(*conn).Read+0x6f               C:/Go/src/net/net.go:177
0x6938ad    net/http.(*connReader).Read+0x10d       C:/Go/src/net/http/server.go:787
0x61fa15    bufio.(*Reader).fill+0x115          C:/Go/src/bufio/bufio.go:100
0x620743    bufio.(*Reader).ReadSlice+0x43          C:/Go/src/bufio/bufio.go:356
0x62097a    bufio.(*Reader).ReadLine+0x3a           C:/Go/src/bufio/bufio.go:385
0x623885    net/textproto.(*Reader).readLineSlice+0x75  C:/Go/src/net/textproto/reader.go:55
0x68dd13    net/textproto.(*Reader).ReadLine+0x93       C:/Go/src/net/textproto/reader.go:36
0x68dd05    net/http.readRequest+0x85           C:/Go/src/net/http/request.go:968
0x694ba9    net/http.(*conn).readRequest+0x169      C:/Go/src/net/http/server.go:967
0x69901e    net/http.(*conn).serve+0x6ae            C:/Go/src/net/http/server.go:1819
1 @ 0x431974 0x42b491 0x42aa0d 0x4c25c2 0x4c38a4 0x4c6fd9 0x4c7278 0x56fe21 0x589bc9 0x58851f 0x69eb66 0x69d9b4 0x69d6eb 0x729b73 0x729b21 0x43157c 0x45cb31
0x42aa0c    internal/poll.runtime_pollWait+0x5c     C:/Go/src/runtime/netpoll.go:182
0x4c25c1    internal/poll.(*pollDesc).wait+0xa1     C:/Go/src/internal/poll/fd_poll_runtime.go:87
0x4c38a3    internal/poll.(*ioSrv).ExecIO+0x123     C:/Go/src/internal/poll/fd_windows.go:228
0x4c6fd8    internal/poll.(*FD).acceptOne+0xa8      C:/Go/src/internal/poll/fd_windows.go:862
0x4c7277    internal/poll.(*FD).Accept+0x147        C:/Go/src/internal/poll/fd_windows.go:896
0x56fe20    net.(*netFD).accept+0x80            C:/Go/src/net/fd_windows.go:193
0x589bc8    net.(*TCPListener).accept+0x38          C:/Go/src/net/tcpsock_posix.go:139
0x58851e    net.(*TCPListener).AcceptTCP+0x4e       C:/Go/src/net/tcpsock.go:247
0x69eb65    net/http.tcpKeepAliveListener.Accept+0x35   C:/Go/src/net/http/server.go:3264
0x69d9b3    net/http.(*Server).Serve+0x233          C:/Go/src/net/http/server.go:2859
0x69d6ea    net/http.(*Server).ListenAndServe+0xea      C:/Go/src/net/http/server.go:2797
0x729b72    net/http.ListenAndServe+0x92            C:/Go/src/net/http/server.go:3037
0x729b20    main.main+0x40                  D:/jusanban/doc/50-编码实现/GO/src/pprofDemo/demo.go:17
0x43157b    runtime.main+0x20b              C:/Go/src/runtime/proc.go:200
1 @ 0x6933d0 0x45cb31
0x6933d0    net/http.(*connReader).backgroundRead+0x0   C:/Go/src/net/http/server.go:676
1 @ 0x71ed87 0x71eb97 0x71b737 0x72874d 0x7291ae 0x69a22b 0x69c13d 0x69d592 0x6991c3 0x45cb31
0x71ed86    runtime/pprof.writeRuntimeProfile+0x96  C:/Go/src/runtime/pprof/pprof.go:708
0x71eb96    runtime/pprof.writeGoroutine+0xa6   C:/Go/src/runtime/pprof/pprof.go:670
0x71b736    runtime/pprof.(*Profile).WriteTo+0x396  C:/Go/src/runtime/pprof/pprof.go:329
0x72874c    net/http/pprof.handler.ServeHTTP+0x35c  C:/Go/src/net/http/pprof/pprof.go:245
0x7291ad    net/http/pprof.Index+0x6fd      C:/Go/src/net/http/pprof/pprof.go:268
0x69a22a    net/http.HandlerFunc.ServeHTTP+0x4a C:/Go/src/net/http/server.go:1995
0x69c13c    net/http.(*ServeMux).ServeHTTP+0x1dc    C:/Go/src/net/http/server.go:2375
0x69d591    net/http.serverHandler.ServeHTTP+0xb1   C:/Go/src/net/http/server.go:2774
0x6991c2    net/http.(*conn).serve+0x852        C:/Go/src/net/http/server.go:1878
复制
3.5 heap - 存活对象的内存分配情况
点击 | 23 | heap | 获得当前当前运行的goroutine跟踪。
结果:
heap profile: 585: 323462320 [4219: 1613030288] @ heap/1048576
1: 323452928 [1: 323452928] @ 0x729d16 0x729c35 0x45cb31
#   0x729d15    pprofDemo/data.Add+0x165    D:/jusanban/doc/50-编码实现/GO/src/pprofDemo/data/d.go:8
#   0x729c34    main.main.func1+0x84        D:/jusanban/doc/50-编码实现/GO/src/pprofDemo/demo.go:13
583: 9328 [583: 9328] @ 0x729c83 0x729c35 0x45cb31
0x729c82    pprofDemo/data.Add+0xd2 D:/jusanban/doc/50-编码实现/GO/src/pprofDemo/data/d.go:7
0x729c34    main.main.func1+0x84    D:/jusanban/doc/50-编码实现/GO/src/pprofDemo/demo.go:13
1: 64 [2377: 152128] @ 0x49c621 0x4c62dd 0x4c5c8c 0x4cbeb7 0x4cbe8a 0x4e4125 0x4e4e13 0x729c34 0x45cb31
0x49c620    unicode/utf16.Encode+0x70       C:/Go/src/unicode/utf16/utf16.go:64
0x4c62dc    internal/poll.(*FD).writeConsole+0x43c  C:/Go/src/internal/poll/fd_windows.go:732
0x4c5c8b    internal/poll.(*FD).Write+0x19b     C:/Go/src/internal/poll/fd_windows.go:676
0x4cbeb6    os.(*File).write+0x76           C:/Go/src/os/file_windows.go:224
0x4cbe89    os.(*File).Write+0x49           C:/Go/src/os/file.go:145
0x4e4124    log.(*Logger).Output+0x204      C:/Go/src/log/log.go:172
0x4e4e12    log.Println+0x72            C:/Go/src/log/log.go:308
0x729c33    main.main.func1+0x83            D:/jusanban/doc/50-编码实现/GO/src/pprofDemo/demo.go:13
0: 0 [0: 0] @ 0x729d16 0x729c35 0x45cb31
0x729d15    pprofDemo/data.Add+0x165    D:/jusanban/doc/50-编码实现/GO/src/pprofDemo/data/d.go:8
0x729c34    main.main.func1+0x84        D:/jusanban/doc/50-编码实现/GO/src/pprofDemo/demo.go:13
0: 0 [1: 165601280] @ 0x729d16 0x729c35 0x45cb31
0x729d15    pprofDemo/data.Add+0x165    D:/jusanban/doc/50-编码实现/GO/src/pprofDemo/data/d.go:8
0x729c34    main.main.func1+0x84        D:/jusanban/doc/50-编码实现/GO/src/pprofDemo/demo.go:13
0: 0 [1: 132481024] @ 0x729d16 0x729c35 0x45cb31
0x729d15    pprofDemo/data.Add+0x165    D:/jusanban/doc/50-编码实现/GO/src/pprofDemo/data/d.go:8
0x729c34    main.main.func1+0x84        D:/jusanban/doc/50-编码实现/GO/src/pprofDemo/demo.go:13
0: 0 [1: 105979904] @ 0x729d16 0x729c35 0x45cb31
0x729d15    pprofDemo/data.Add+0x165    D:/jusanban/doc/50-编码实现/GO/src/pprofDemo/data/d.go:8
0x729c34    main.main.func1+0x84        D:/jusanban/doc/50-编码实现/GO/src/pprofDemo/demo.go:13
0: 0 [1: 84779008] @ 0x729d16 0x729c35 0x45cb31
0x729d15    pprofDemo/data.Add+0x165    D:/jusanban/doc/50-编码实现/GO/src/pprofDemo/data/d.go:8
0x729c34    main.main.func1+0x84        D:/jusanban/doc/50-编码实现/GO/src/pprofDemo/demo.go:13
0: 0 [1: 67821568] @ 0x729d16 0x729c35 0x45cb31
0x729d15    pprofDemo/data.Add+0x165    D:/jusanban/doc/50-编码实现/GO/src/pprofDemo/data/d.go:8
0x729c34    main.main.func1+0x84        D:/jusanban/doc/50-编码实现/GO/src/pprofDemo/demo.go:13
0: 0 [1: 54255616] @ 0x729d16 0x729c35 0x45cb31
0x729d15    pprofDemo/data.Add+0x165    D:/jusanban/doc/50-编码实现/GO/src/pprofDemo/data/d.go:8
0x729c34    main.main.func1+0x84        D:/jusanban/doc/50-编码实现/GO/src/pprofDemo/demo.go:13
0: 0 [1: 43401216] @ 0x729d16 0x729c35 0x45cb31
0x729d15    pprofDemo/data.Add+0x165    D:/jusanban/doc/50-编码实现/GO/src/pprofDemo/data/d.go:8
0x729c34    main.main.func1+0x84        D:/jusanban/doc/50-编码实现/GO/src/pprofDemo/demo.go:13
0: 0 [1: 34717696] @ 0x729d16 0x729c35 0x45cb31
0x729d15    pprofDemo/data.Add+0x165    D:/jusanban/doc/50-编码实现/GO/src/pprofDemo/data/d.go:8
0x729c34    main.main.func1+0x84        D:/jusanban/doc/50-编码实现/GO/src/pprofDemo/demo.go:13
0: 0 [1: 27770880] @ 0x729d16 0x729c35 0x45cb31
0x729d15    pprofDemo/data.Add+0x165    D:/jusanban/doc/50-编码实现/GO/src/pprofDemo/data/d.go:8
0x729c34    main.main.func1+0x84        D:/jusanban/doc/50-编码实现/GO/src/pprofDemo/demo.go:13
0: 0 [1: 22216704] @ 0x729d16 0x729c35 0x45cb31
0x729d15    pprofDemo/data.Add+0x165    D:/jusanban/doc/50-编码实现/GO/src/pprofDemo/data/d.go:8
0x729c34    main.main.func1+0x84        D:/jusanban/doc/50-编码实现/GO/src/pprofDemo/demo.go:13
0: 0 [1: 17768448] @ 0x729d16 0x729c35 0x45cb31
0x729d15    pprofDemo/data.Add+0x165    D:/jusanban/doc/50-编码实现/GO/src/pprofDemo/data/d.go:8
0x729c34    main.main.func1+0x84        D:/jusanban/doc/50-编码实现/GO/src/pprofDemo/demo.go:13
0: 0 [1: 14213120] @ 0x729d16 0x729c35 0x45cb31
0x729d15    pprofDemo/data.Add+0x165    D:/jusanban/doc/50-编码实现/GO/src/pprofDemo/data/d.go:8
0x729c34    main.main.func1+0x84        D:/jusanban/doc/50-编码实现/GO/src/pprofDemo/demo.go:13
0: 0 [1: 11370496] @ 0x729d16 0x729c35 0x45cb31
0x729d15    pprofDemo/data.Add+0x165    D:/jusanban/doc/50-编码实现/GO/src/pprofDemo/data/d.go:8
0x729c34    main.main.func1+0x84        D:/jusanban/doc/50-编码实现/GO/src/pprofDemo/demo.go:13
0: 0 [1: 9093120] @ 0x729d16 0x729c35 0x45cb31
0x729d15    pprofDemo/data.Add+0x165    D:/jusanban/doc/50-编码实现/GO/src/pprofDemo/data/d.go:8
0x729c34    main.main.func1+0x84        D:/jusanban/doc/50-编码实现/GO/src/pprofDemo/demo.go:13
0: 0 [1: 7274496] @ 0x729d16 0x729c35 0x45cb31
0x729d15    pprofDemo/data.Add+0x165    D:/jusanban/doc/50-编码实现/GO/src/pprofDemo/data/d.go:8
0x729c34    main.main.func1+0x84        D:/jusanban/doc/50-编码实现/GO/src/pprofDemo/demo.go:13
0: 0 [1: 5816320] @ 0x729d16 0x729c35 0x45cb31
0x729d15    pprofDemo/data.Add+0x165    D:/jusanban/doc/50-编码实现/GO/src/pprofDemo/data/d.go:8
0x729c34    main.main.func1+0x84        D:/jusanban/doc/50-编码实现/GO/src/pprofDemo/demo.go:13
0: 0 [1: 4653056] @ 0x729d16 0x729c35 0x45cb31
0x729d15    pprofDemo/data.Add+0x165    D:/jusanban/doc/50-编码实现/GO/src/pprofDemo/data/d.go:8
0x729c34    main.main.func1+0x84        D:/jusanban/doc/50-编码实现/GO/src/pprofDemo/demo.go:13
0: 0 [1: 3719168] @ 0x729d16 0x729c35 0x45cb31
0x729d15    pprofDemo/data.Add+0x165    D:/jusanban/doc/50-编码实现/GO/src/pprofDemo/data/d.go:8
0x729c34    main.main.func1+0x84        D:/jusanban/doc/50-编码实现/GO/src/pprofDemo/demo.go:13
0: 0 [1: 2973696] @ 0x729d16 0x729c35 0x45cb31
0x729d15    pprofDemo/data.Add+0x165    D:/jusanban/doc/50-编码实现/GO/src/pprofDemo/data/d.go:8
0x729c34    main.main.func1+0x84        D:/jusanban/doc/50-编码实现/GO/src/pprofDemo/demo.go:13
0: 0 [1: 2375680] @ 0x729d16 0x729c35 0x45cb31
0x729d15    pprofDemo/data.Add+0x165    D:/jusanban/doc/50-编码实现/GO/src/pprofDemo/data/d.go:8
0x729c34    main.main.func1+0x84        D:/jusanban/doc/50-编码实现/GO/src/pprofDemo/demo.go:13
0: 0 [1: 1900544] @ 0x729d16 0x729c35 0x45cb31
0x729d15    pprofDemo/data.Add+0x165    D:/jusanban/doc/50-编码实现/GO/src/pprofDemo/data/d.go:8
0x729c34    main.main.func1+0x84        D:/jusanban/doc/50-编码实现/GO/src/pprofDemo/demo.go:13
0: 0 [1: 1515520] @ 0x729d16 0x729c35 0x45cb31
0x729d15    pprofDemo/data.Add+0x165    D:/jusanban/doc/50-编码实现/GO/src/pprofDemo/data/d.go:8
0x729c34    main.main.func1+0x84        D:/jusanban/doc/50-编码实现/GO/src/pprofDemo/demo.go:13
0: 0 [617: 9872] @ 0x729bf6 0x45cb31
0x729bf5    main.main.func1+0x45    D:/jusanban/doc/50-编码实现/GO/src/pprofDemo/demo.go:13
0: 0 [1: 207003648] @ 0x729d16 0x729c35 0x45cb31
0x729d15    pprofDemo/data.Add+0x165    D:/jusanban/doc/50-编码实现/GO/src/pprofDemo/data/d.go:8
0x729c34    main.main.func1+0x84        D:/jusanban/doc/50-编码实现/GO/src/pprofDemo/demo.go:13
0: 0 [1: 966656] @ 0x729d16 0x729c35 0x45cb31
0x729d15    pprofDemo/data.Add+0x165    D:/jusanban/doc/50-编码实现/GO/src/pprofDemo/data/d.go:8
0x729c34    main.main.func1+0x84        D:/jusanban/doc/50-编码实现/GO/src/pprofDemo/demo.go:13
0: 0 [1: 770048] @ 0x729d16 0x729c35 0x45cb31
0x729d15    pprofDemo/data.Add+0x165    D:/jusanban/doc/50-编码实现/GO/src/pprofDemo/data/d.go:8
0x729c34    main.main.func1+0x84        D:/jusanban/doc/50-编码实现/GO/src/pprofDemo/demo.go:13
0: 0 [1: 258760704] @ 0x729d16 0x729c35 0x45cb31
0x729d15    pprofDemo/data.Add+0x165    D:/jusanban/doc/50-编码实现/GO/src/pprofDemo/data/d.go:8
0x729c34    main.main.func1+0x84        D:/jusanban/doc/50-编码实现/GO/src/pprofDemo/demo.go:13
0: 0 [613: 9808] @ 0x4d5445 0x4e4de6 0x729c34 0x45cb31
0x4d5444    fmt.Sprintln+0x84   C:/Go/src/fmt/print.go:283
0x4e4de5    log.Println+0x45    C:/Go/src/log/log.go:308
0x729c33    main.main.func1+0x83    D:/jusanban/doc/50-编码实现/GO/src/pprofDemo/demo.go:13
0: 0 [1: 122880] @ 0x729d16 0x729c35 0x45cb31
0x729d15    pprofDemo/data.Add+0x165    D:/jusanban/doc/50-编码实现/GO/src/pprofDemo/data/d.go:8
0x729c34    main.main.func1+0x84        D:/jusanban/doc/50-编码实现/GO/src/pprofDemo/demo.go:13
0: 0 [1: 73728] @ 0x729d16 0x729c35 0x45cb31
0x729d15    pprofDemo/data.Add+0x165    D:/jusanban/doc/50-编码实现/GO/src/pprofDemo/data/d.go:8
0x729c34    main.main.func1+0x84        D:/jusanban/doc/50-编码实现/GO/src/pprofDemo/demo.go:13
runtime.MemStats
Alloc = 903008744
TotalAlloc = 4550869808
Sys = 2158105336
Lookups = 0
Mallocs = 90329339
Frees = 63460678
HeapAlloc = 903008744
HeapSys = 2063400960
HeapIdle = 1159651328
HeapInuse = 903749632
HeapReleased = 825802752
HeapObjects = 26868661
Stack = 196608 / 196608
MSpan = 8942688 / 9273344
MCache = 6816 / 16384
BuckHashSys = 1449689
GCSys = 81020416
OtherSys = 2747935
NextGC = 1487502224
LastGC = 1565434372301738700
PauseNs = [0 0 0 0 0 0 0 0 0 0 0 0 0 0 0 0 0 0 0 0 0 0 0 0 0 0 0 0 0 0 0 0 0 0 0 0 0 0 0 0 0 0 0 0 0 0 0 0 0 0 0 0 0 0 0 0 0 0 0 0 0 0 0 0 0 0 0 0 0 0 0 0 0 0 0 0 0 0 0 0 0 0 0 0 0 0 0 0 0 0 0 0 0 0 0 0 0 0 0 0 0 0 0 0 0 0 0 0 0 0 0 0 0 0 0 0 0 0 0 0 0 0 0 0 0 0 0 0 0 0 0 0 0 0 0 0 0 0 0 0 0 0 0 0 0 0 0 0 0 0 0 0 0 0 0 0 0 0 0 0 0 0 0 0 0 0 0 0 0 0 0 0 0 0 0 0 0 0 0 0 0 0 0 0 0 0 0 0 0 0 0 0 0 0 0 0 0 0 0 0 0 0 0 0 0 0 0 0 0 0 0 0 0 0 0 0 0 0 0 0 0 0 0 0 0 0 0 0 0 0 0 0 0 0 0 0 0 0 0 0 0 0 0 0 0 0 0 0 0 0 0 0 0 0 0 0]
PauseEnd = [1565433169073748700 1565433170816751000 1565433172159983400 1565433172945533000 1565433174099874000 1565433175518063100 1565433177619860000 1565433179975512400 1565433181864431500 1565433184265065100 1565433187523962900 1565433191149906300 1565433195655882800 1565433202544943300 1565433210091628000 1565433219576071700 1565433231443300400 1565433250042853500 1565433271147866600 1565433296270582800 1565433329182917200 1565433367374672600 1565433417148020100 1565433481563290200 1565433564539085100 1565433658736311100 1565433768426224400 1565433888753832600 1565433950011017300 1565434070459967800 1565434152222298100 1565434272871724400 1565434372301738700 0 0 0 0 0 0 0 0 0 0 0 0 0 0 0 0 0 0 0 0 0 0 0 0 0 0 0 0 0 0 0 0 0 0 0 0 0 0 0 0 0 0 0 0 0 0 0 0 0 0 0 0 0 0 0 0 0 0 0 0 0 0 0 0 0 0 0 0 0 0 0 0 0 0 0 0 0 0 0 0 0 0 0 0 0 0 0 0 0 0 0 0 0 0 0 0 0 0 0 0 0 0 0 0 0 0 0 0 0 0 0 0 0 0 0 0 0 0 0 0 0 0 0 0 0 0 0 0 0 0 0 0 0 0 0 0 0 0 0 0 0 0 0 0 0 0 0 0 0 0 0 0 0 0 0 0 0 0 0 0 0 0 0 0 0 0 0 0 0 0 0 0 0 0 0 0 0 0 0 0 0 0 0 0 0 0 0 0 0 0 0 0 0 0 0 0 0 0 0 0 0 0 0 0 0 0 0 0 0 0 0 0 0 0 0 0 0 0 0 0 0 0 0]
NumGC = 33
NumForcedGC = 0
GCCPUFraction = 0.0013550620011245496
DebugGC = false
复制
3.7 mutex - 互斥锁的竞争持有者的堆栈跟踪
点击 | mutex | 导致互斥锁的竞争持有者的堆栈跟踪。
结果:
--- mutex:
cycles/second=2181652749
sampling period=0
复制3.6 profile - 默认进行 30s 的 CPU Profiling
点击 profile 默认进行 30s 的 CPU Profiling,得到一个分析用的 profile 文件。
结果: 得到一个分析用的 profile 文件,需要用后面的专用工具分析查看。
3.8 threadcreate - 操作系统线程跟踪
点击 | 7 | threadcreate 获得操作系统线程跟踪。
结果:
threadcreate profile: total 8
8 @
#   0x0
复制3.9 trace - 当前程序执行情况
点击 | 0 | trace | 获得当前程序的执行情况,
结果: 得到一个分析用的 trace 文件,需要用后面的专用工具分析查看。
3.10 full goroutine stack dump - 所有goroutine栈输出
点击full goroutine stack dump获得所有goroutine栈输出。 结果:
goroutine 27 [running]:
runtime/pprof.writeGoroutineStacks(0x869360, 0xc00829e000, 0x0, 0x0)
    C:/Go/src/runtime/pprof/pprof.go:679 +0xa4
runtime/pprof.writeGoroutine(0x869360, 0xc00829e000, 0x2, 0x40c043, 0xc008282160)
    C:/Go/src/runtime/pprof/pprof.go:668 +0x4b
runtime/pprof.(*Profile).WriteTo(0xae74c0, 0x869360, 0xc00829e000, 0x2, 0xc00829e000, 0xc0000f6000)
    C:/Go/src/runtime/pprof/pprof.go:329 +0x397
net/http/pprof.handler.ServeHTTP(0xc00000a371, 0x9, 0x86f3e0, 0xc00829e000, 0xc0000dc400)
    C:/Go/src/net/http/pprof/pprof.go:245 +0x35d
net/http/pprof.Index(0x86f3e0, 0xc00829e000, 0xc0000dc400)
    C:/Go/src/net/http/pprof/pprof.go:268 +0x6fe
net/http.HandlerFunc.ServeHTTP(0x807588, 0x86f3e0, 0xc00829e000, 0xc0000dc400)
    C:/Go/src/net/http/server.go:1995 +0x4b
net/http.(*ServeMux).ServeHTTP(0xaf4c20, 0x86f3e0, 0xc00829e000, 0xc0000dc400)
    C:/Go/src/net/http/server.go:2375 +0x1dd
net/http.serverHandler.ServeHTTP(0xc0000f41a0, 0x86f3e0, 0xc00829e000, 0xc0000dc400)
    C:/Go/src/net/http/server.go:2774 +0xb2
net/http.(*conn).serve(0xc0000548c0, 0x86fa20, 0xc000038500)
    C:/Go/src/net/http/server.go:1878 +0x853
created by net/http.(*Server).Serve
    C:/Go/src/net/http/server.go:2884 +0x2fb
goroutine 1 [IO wait]:
internal/poll.runtime_pollWait(0x1460ea8, 0x72, 0x869ee0)
C:/Go/src/runtime/netpoll.go:182 +0x5d
internal/poll.(pollDesc).wait(0xc0001001c8, 0x72, 0xab8400, 0x0, 0x0)
C:/Go/src/internal/poll/fd_poll_runtime.go:87 +0xa2
internal/poll.(ioSrv).ExecIO(0xaf2b90, 0xc000100018, 0xc0000040a0, 0x1, 0x0, 0x170)
C:/Go/src/internal/poll/fd_windows.go:228 +0x124
internal/poll.(FD).acceptOne(0xc000100000, 0x170, 0xc00feb60f0, 0x2, 0x2, 0xc000100018, 0xc000008e00, 0xc0003e5c10, 0x40c8ff, 0x10)
C:/Go/src/internal/poll/fd_windows.go:862 +0xa9
internal/poll.(FD).Accept(0xc000100000, 0xc003276000, 0x0, 0x0, 0x0, 0x0, 0xc000000000, 0x0, 0x0, 0x0, ...)
C:/Go/src/internal/poll/fd_windows.go:896 +0x148
net.(netFD).accept(0xc000100000, 0xc000020570, 0xc000020500, 0x40c043)
C:/Go/src/net/fd_windows.go:193 +0x81
net.(TCPListener).accept(0xc000006040, 0xc0003e5dd0, 0xba04deba, 0xbe1590eba5ab90d)
C:/Go/src/net/tcpsock_posix.go:139 +0x39
net.(TCPListener).AcceptTCP(0xc000006040, 0xc0000f4230, 0x4b904d, 0x5d4ea46c)
C:/Go/src/net/tcpsock.go:247 +0x4f
net/http.tcpKeepAliveListener.Accept(0xc000006040, 0xc0003e5e48, 0x18, 0xc00002c000, 0x69da7b)
C:/Go/src/net/http/server.go:3264 +0x36
net/http.(Server).Serve(0xc0000f41a0, 0x86f5a0, 0xc000006040, 0x0, 0x0)
C:/Go/src/net/http/server.go:2859 +0x234
net/http.(*Server).ListenAndServe(0xc0000f41a0, 0xc0000f41a0, 0xc000044058)
C:/Go/src/net/http/server.go:2797 +0xeb
net/http.ListenAndServe(...)
C:/Go/src/net/http/server.go:3037
main.main()
D:/jusanban/doc/50-编码实现/GO/src/pprofDemo/demo.go:17 +0x93
goroutine 4 [runnable, locked to thread]:
syscall.Syscall6(0x7ffcd4681730, 0x5, 0x134, 0xc00827e700, 0x20, 0xc0003e78e8, 0x0, 0x0, 0x0, 0x0, ...)
C:/Go/src/runtime/syscall_windows.go:199 +0xed
syscall.WriteConsole(0x134, 0xc00827e700, 0x20, 0xc0003e78e8, 0x0, 0x20, 0x0)
C:/Go/src/syscall/zsyscall_windows.go:1297 +0xb6
internal/poll.(FD).writeConsole(0xc000082500, 0xc0001048a0, 0x20, 0x20, 0x4e39f2, 0xc00008c030, 0x1d)
C:/Go/src/internal/poll/fd_windows.go:735 +0x36b
internal/poll.(FD).Write(0xc000082500, 0xc0001048a0, 0x20, 0x20, 0x0, 0x0, 0x0)
C:/Go/src/internal/poll/fd_windows.go:676 +0x19c
os.(File).write(...)
C:/Go/src/os/file_windows.go:224
os.(File).Write(0xc000080010, 0xc0001048a0, 0x20, 0x20, 0xaf4c60, 0x0, 0x0)
C:/Go/src/os/file.go:145 +0x77
log.(*Logger).Output(0xc00008c000, 0x2, 0xc01c2fb750, 0xc, 0x0, 0x0)
C:/Go/src/log/log.go:172 +0x205
log.Println(0xc0003e7fc0, 0x1, 0x1)
C:/Go/src/log/log.go:308 +0x73
main.main.func1()
D:/jusanban/doc/50-编码实现/GO/src/pprofDemo/demo.go:13 +0x84
created by main.main
D:/jusanban/doc/50-编码实现/GO/src/pprofDemo/demo.go:11 +0x40
goroutine 66 [runnable]:
internal/poll.runtime_pollWait(0x1460dd8, 0x72, 0x869ee0)
C:/Go/src/runtime/netpoll.go:182 +0x5d
internal/poll.(pollDesc).wait(0xc000100748, 0x72, 0xab8400, 0x0, 0x0)
C:/Go/src/internal/poll/fd_poll_runtime.go:87 +0xa2
internal/poll.(ioSrv).ExecIO(0xaf2b90, 0xc000100598, 0x8070b8, 0x40c043, 0xc000038680, 0x40)
C:/Go/src/internal/poll/fd_windows.go:228 +0x124
internal/poll.(FD).Read(0xc000100580, 0xc00bbc0000, 0x1000, 0x1000, 0x0, 0x0, 0x0)
C:/Go/src/internal/poll/fd_windows.go:502 +0x26b
net.(netFD).Read(0xc000100580, 0xc00bbc0000, 0x1000, 0x1000, 0xc000038680, 0xc00b163938, 0x6931f8)
C:/Go/src/net/fd_windows.go:152 +0x56
net.(conn).Read(0xc000006020, 0xc00bbc0000, 0x1000, 0x1000, 0x0, 0x0, 0x0)
C:/Go/src/net/net.go:177 +0x70
net/http.(connReader).Read(0xc00006d200, 0xc00bbc0000, 0x1000, 0x1000, 0x30000, 0x5, 0x30000)
C:/Go/src/net/http/server.go:787 +0x10e
bufio.(Reader).fill(0xc0000d0120)
C:/Go/src/bufio/bufio.go:100 +0x116
bufio.(Reader).ReadSlice(0xc0000d0120, 0xa, 0x1cb888, 0xc00b163b00, 0x40c043, 0xc0000dc300, 0x100)
C:/Go/src/bufio/bufio.go:356 +0x44
bufio.(Reader).ReadLine(0xc0000d0120, 0xc00b163b08, 0xc000008e00, 0x1c06b0, 0x0, 0x40c8ff, 0x30)
C:/Go/src/bufio/bufio.go:385 +0x3b
net/textproto.(Reader).readLineSlice(0xc00006d230, 0xc0000dc300, 0xc000100580, 0x0, 0x0, 0x42f1b8)
C:/Go/src/net/textproto/reader.go:55 +0x76
net/textproto.(Reader).ReadLine(...)
C:/Go/src/net/textproto/reader.go:36
net/http.readRequest(0xc0000d0120, 0x0, 0xc0000dc300, 0x0, 0x0)
C:/Go/src/net/http/request.go:968 +0x94
net/http.(conn).readRequest(0xc000054280, 0x86fa20, 0xc000038640, 0x0, 0x0, 0x0)
C:/Go/src/net/http/server.go:967 +0x16a
net/http.(conn).serve(0xc000054280, 0x86fa20, 0xc000038640)
C:/Go/src/net/http/server.go:1819 +0x6af
created by net/http.(Server).Serve
C:/Go/src/net/http/server.go:2884 +0x2fb
goroutine 41 [runnable]:
net/http.(connReader).backgroundRead(0xc0000e8990)
C:/Go/src/net/http/server.go:676
created by net/http.(connReader).startBackgroundRead
C:/Go/src/net/http/server.go:673 +0xd1
复制4. 通过交互式终端分析
4.1 时长为60s的CPU占用分析
程序运行情况下,命令行输入:
go tool pprof http://localhost:6060/debug/pprof/profile?seconds=60
结果输出:
PS D:\jusanban\doc\50-编码实现\GO\src\pprofDemo> go tool pprof http://localhost:6060/debug/pprof/profile?seconds=60
Fetching profile over HTTP from http://localhost:6060/debug/pprof/profile?seconds=60
Saved profile in C:\Users\dd\pprof\pprof.samples.cpu.016.pb.gz
Type: cpu
Time: Aug 10, 2019 at 8:07pm (CST)
Duration: 1mins, Total samples = 1.01mins (100.51%)
Entering interactive mode (type "help" for commands, "o" for options)
(pprof)
复制执行该命令后,需等待 60 秒(可调整 seconds 的值),pprof 会进行 CPU Profiling。结束后将默认进入 pprof 的交互式命令模式,可以对分析的结果进行查看或导出。具体可执行 pprof help 查看命令说明。
4.1.1 top
top查看前10行数的CPU占用情况:
(pprof) top
Showing nodes accounting for 56.49s, 93.48% of 60.43s total
Dropped 125 nodes (cum <= 0.30s)
Showing top 10 nodes out of 25
      flat  flat%   sum%        cum   cum%
    53.72s 88.90% 88.90%     54.03s 89.41%  runtime.cgocall
     0.50s  0.83% 89.72%     56.20s 93.00%  internal/poll.(*FD).writeConsole
     0.45s  0.74% 90.47%      0.86s  1.42%  runtime.mallocgc
     0.36s   0.6% 91.06%      0.36s   0.6%  runtime.memmove
     0.36s   0.6% 91.66%      0.36s   0.6%  unicode/utf8.DecodeRune
     0.27s  0.45% 92.11%      0.54s  0.89%  unicode/utf16.Encode
     0.25s  0.41% 92.52%      0.31s  0.51%  runtime.deferreturn
     0.24s   0.4% 92.92%      0.44s  0.73%  runtime.scanobject
     0.18s   0.3% 93.22%     54.74s 90.58%  syscall.WriteConsole
     0.16s  0.26% 93.48%     57.88s 95.78%  log.(*Logger).Output
复制【说明】
- flat:采样时,该函数正在运行的次数*采样频率(10ms),即得到估算的函数运行”采样时间”。这里不包括函数等待子函数返回;
- flat%:同上的 CPU 运行耗时总比例;
- sum%:给定函数累积使用 CPU 总比例,如第二行 sum% = 89.72% = 88.90% + 0.83%
- cum:当前函数加上它之上的调用运行总耗时,包括函数等待子函数返回。因此 flat <= cum;
- cum%:同上的 CPU 运行耗时总比例
- 最后一列为函数名称;
4.1.2 tree
树形结构查看goroutine情况。
(pprof) tree
Showing nodes accounting for 57.12s, 94.52% of 60.43s total
Dropped 125 nodes (cum <= 0.30s)
----------------------------------------------------------+-------------
      flat  flat%   sum%        cum   cum%   calls calls% + context
----------------------------------------------------------+-------------
                                            54.03s   100% |   syscall.Syscall6
    53.72s 88.90% 88.90%     54.03s 89.41%                | runtime.cgocall
----------------------------------------------------------+-------------
                                            56.20s   100% |   internal/poll.(*FD).Write
     0.50s  0.83% 89.72%     56.20s 93.00%                | internal/poll.(*FD).writeConsole
                                            54.74s 97.40% |   syscall.WriteConsole
                                             0.54s  0.96% |   unicode/utf16.Encode
                                             0.36s  0.64% |   unicode/utf8.DecodeRune
----------------------------------------------------------+-------------
                                             0.37s 43.02% |   runtime.slicebytetostring
                                             0.31s 36.05% |   runtime.convTstring
                                             0.15s 17.44% |   unicode/utf16.Encode
     0.45s  0.74% 90.47%      0.86s  1.42%                | runtime.mallocgc
----------------------------------------------------------+-------------
                                             0.16s 44.44% |   pprofDemo/data.Add
                                             0.09s 25.00% |   log.(*Logger).formatHeader
                                             0.07s 19.44% |   fmt.Sprintln
     0.36s   0.6% 91.06%      0.36s   0.6%                | runtime.memmove
----------------------------------------------------------+-------------
                                             0.36s   100% |   internal/poll.(*FD).writeConsole
     0.36s   0.6% 91.66%      0.36s   0.6%                | unicode/utf8.DecodeRune
----------------------------------------------------------+-------------
                                             0.54s   100% |   internal/poll.(*FD).writeConsole
     0.27s  0.45% 92.11%      0.54s  0.89%                | unicode/utf16.Encode
                                             0.15s 27.78% |   runtime.mallocgc
----------------------------------------------------------+-------------
                                             0.21s 67.74% |   syscall.Syscall6
                                             0.08s 25.81% |   internal/poll.(*FD).Write
     0.25s  0.41% 92.52%      0.31s  0.51%                | runtime.deferreturn
----------------------------------------------------------+-------------
                                             0.44s   100% |   runtime.gcDrain
     0.24s   0.4% 92.92%      0.44s  0.73%                | runtime.scanobject
----------------------------------------------------------+-------------
                                            54.74s   100% |   internal/poll.(*FD).writeConsole
     0.18s   0.3% 93.22%     54.74s 90.58%                | syscall.WriteConsole
                                            54.49s 99.54% |   syscall.Syscall6
----------------------------------------------------------+-------------
                                            57.88s   100% |   log.Println
     0.16s  0.26% 93.48%     57.88s 95.78%                | log.(*Logger).Output
                                            56.80s 98.13% |   os.(*File).Write
                                             0.56s  0.97% |   log.(*Logger).formatHeader
----------------------------------------------------------+-------------
                                             0.56s   100% |   log.(*Logger).Output
     0.13s  0.22% 93.70%      0.56s  0.93%                | log.(*Logger).formatHeader
                                             0.09s 16.07% |   runtime.memmove
----------------------------------------------------------+-------------
                                            54.49s   100% |   syscall.WriteConsole
     0.11s  0.18% 93.88%     54.49s 90.17%                | syscall.Syscall6
                                            54.03s 99.16% |   runtime.cgocall
                                             0.21s  0.39% |   runtime.deferreturn
----------------------------------------------------------+-------------
                                            56.70s   100% |   os.(*File).write
     0.09s  0.15% 94.03%     56.70s 93.83%                | internal/poll.(*FD).Write
                                            56.20s 99.12% |   internal/poll.(*FD).writeConsole
                                             0.08s  0.14% |   runtime.deferreturn
----------------------------------------------------------+-------------
                                             0.79s   100% |   main.main.func1
     0.07s  0.12% 94.14%      0.79s  1.31%                | pprofDemo/data.Add
                                             0.32s 40.51% |   runtime.slicebytetostring
                                             0.16s 20.25% |   runtime.memmove
                                             0.14s 17.72% |   runtime.systemstack
----------------------------------------------------------+-------------
                                            56.76s   100% |   os.(*File).Write
     0.06s 0.099% 94.24%     56.76s 93.93%                | os.(*File).write
                                            56.70s 99.89% |   internal/poll.(*FD).Write
----------------------------------------------------------+-------------
                                             0.64s   100% |   log.Println
     0.05s 0.083% 94.32%      0.64s  1.06%                | fmt.Sprintln
                                             0.08s 12.50% |   runtime.slicebytetostring
                                             0.07s 10.94% |   runtime.memmove
----------------------------------------------------------+-------------
                                            56.80s   100% |   log.(*Logger).Output
     0.04s 0.066% 94.39%     56.80s 93.99%                | os.(*File).Write
                                            56.76s 99.93% |   os.(*File).write
----------------------------------------------------------+-------------
                                             0.34s   100% |   main.main.func1
     0.03s  0.05% 94.44%      0.34s  0.56%                | runtime.convTstring
                                             0.31s 91.18% |   runtime.mallocgc
----------------------------------------------------------+-------------
                                            58.54s   100% |   main.main.func1
     0.02s 0.033% 94.47%     58.54s 96.87%                | log.Println
                                            57.88s 98.87% |   log.(*Logger).Output
                                             0.64s  1.09% |   fmt.Sprintln
----------------------------------------------------------+-------------
                                             0.32s 80.00% |   pprofDemo/data.Add
                                             0.08s 20.00% |   fmt.Sprintln
     0.02s 0.033% 94.51%      0.40s  0.66%                | runtime.slicebytetostring
                                             0.37s 92.50% |   runtime.mallocgc
----------------------------------------------------------+-------------
     0.01s 0.017% 94.52%     59.68s 98.76%                | main.main.func1
                                            58.54s 98.09% |   log.Println
                                             0.79s  1.32% |   pprofDemo/data.Add
                                             0.34s  0.57% |   runtime.convTstring
----------------------------------------------------------+-------------
         0     0% 94.52%      0.55s  0.91%                | runtime.gcBgMarkWorker
                                             0.55s   100% |   runtime.systemstack
----------------------------------------------------------+-------------
                                             0.63s   100% |   runtime.systemstack
         0     0% 94.52%      0.63s  1.04%                | runtime.gcBgMarkWorker.func2
                                             0.63s   100% |   runtime.gcDrain
----------------------------------------------------------+-------------
                                             0.63s   100% |   runtime.gcBgMarkWorker.func2
         0     0% 94.52%      0.63s  1.04%                | runtime.gcDrain
                                             0.44s 69.84% |   runtime.scanobject
----------------------------------------------------------+-------------
                                             0.55s 63.95% |   runtime.gcBgMarkWorker
                                             0.14s 16.28% |   pprofDemo/data.Add
         0     0% 94.52%      0.86s  1.42%                | runtime.systemstack
                                             0.63s 73.26% |   runtime.gcBgMarkWorker.func2
----------------------------------------------------------+-------------
(pprof)
复制4.1.3 exit
退出分析,输入exit命令。
(pprof) exit
PS D:\jusanban\doc\50-编码实现\GO\src\pprofDemo>
复制4.2 heap堆分析
go tool pprof http://localhost:6060/debug/pprof/heap
输出结果:
PS D:\jusanban\doc\50-编码实现\GO\src\pprofDemo> go tool pprof http://localhost:6060/debug/pprof/heap
Fetching profile over HTTP from http://localhost:6060/debug/pprof/heap
Saved profile in C:\Users\dd\pprof\pprof.alloc_objects.alloc_space.inuse_objects.inuse_space.002.pb.gz
Type: inuse_space
Time: Aug 10, 2019 at 8:20pm (CST)
Entering interactive mode (type "help" for commands, "o" for options)
复制输入top,可以得知所有栈内存被.Add函数占有,合计410M。
(pprof) top
Showing nodes accounting for 410.42MB, 100% of 410.42MB total
      flat  flat%   sum%        cum   cum%
  410.42MB   100%   100%   410.42MB   100%  pprofDemo/data.Add
         0     0%   100%   410.42MB   100%  main.main.func1
(pprof)
复制4.3 stack栈分析
go tool pprof http://localhost:6060/debug/pprof/allocs
输出结果:
PS D:\jusanban\doc\50-编码实现\GO\src\pprofDemo> go tool pprof http://localhost:6060/debug/pprof/allocs
Fetching profile over HTTP from http://localhost:6060/debug/pprof/allocs
Saved profile in C:\Users\dd\pprof\pprof.alloc_objects.alloc_space.inuse_objects.inuse_space.006.pb.gz
Type: alloc_space
Time: Aug 10, 2019 at 8:33pm (CST)
Entering interactive mode (type "help" for commands, "o" for options)
(pprof) top
Showing nodes accounting for 5127.36MB, 99.83% of 5135.88MB total
Dropped 22 nodes (cum <= 25.68MB)
      flat  flat%   sum%        cum   cum%
 2811.26MB 54.74% 54.74%  2811.26MB 54.74%  pprofDemo/data.Add
 1527.09MB 29.73% 84.47%  1527.09MB 29.73%  unicode/utf16.Encode
  395.51MB  7.70% 92.17%  5127.36MB 99.83%  main.main.func1
  393.51MB  7.66% 99.83%   393.51MB  7.66%  fmt.Sprintln
         0     0% 99.83%  1527.09MB 29.73%  internal/poll.(*FD).Write
         0     0% 99.83%  1527.09MB 29.73%  internal/poll.(*FD).writeConsole
         0     0% 99.83%  1527.09MB 29.73%  log.(*Logger).Output
         0     0% 99.83%  1920.60MB 37.40%  log.Println
         0     0% 99.83%  1527.09MB 29.73%  os.(*File).Write
         0     0% 99.83%  1527.09MB 29.73%  os.(*File).write
(pprof)
复制该命令等同于go tool pprof -alloc_objects http://localhost:6060/debug/pprof/heap的结果。
4.4 其他
go tool pprof http://localhost:6060/debug/pprof/block go tool pprof http://localhost:6060/debug/pprof/goroutine go tool pprof http://localhost:6060/debug/pprof/threadcreate
5. PProf 可视化界面
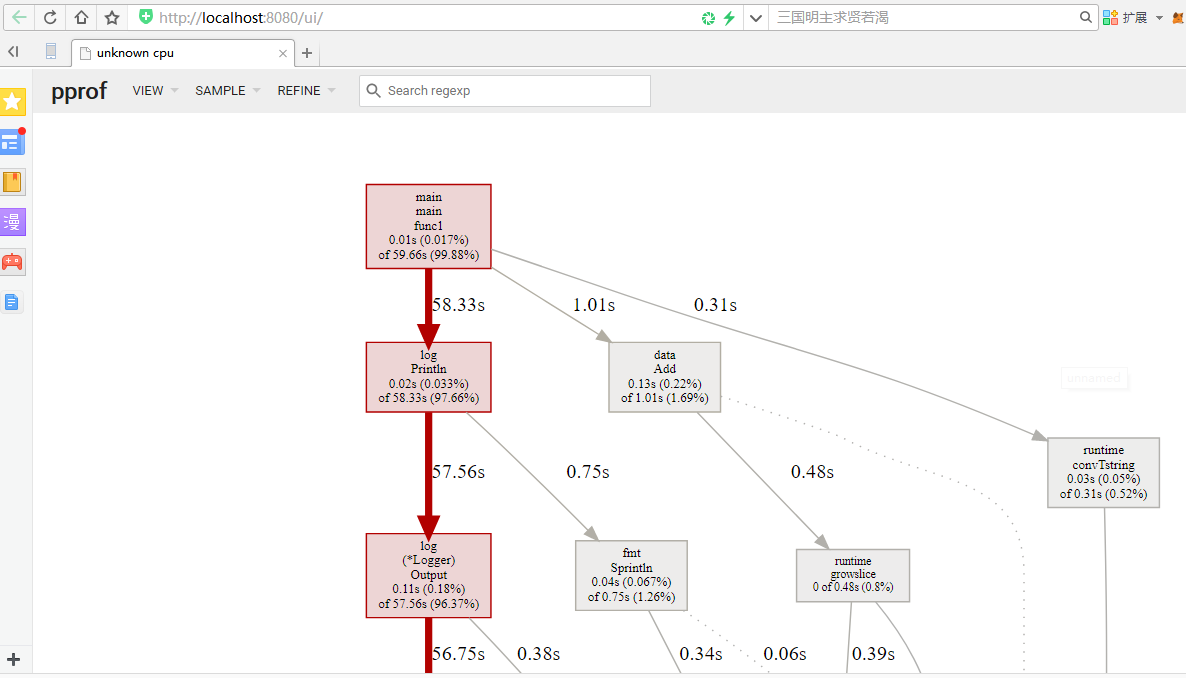
go tool pprof http://localhost:6060/debug/pprof/profile?seconds=60 go tool pprof -http=:8080 http://localhost:6060/debug/pprof/profile?seconds=60
【说明】 -http=:8080 表示启动PProf 可视化界面。默认情况下,会浏览器打开输出图形界面。
例如:
【常见问题1】Could not execute dot; may need to install graphviz.
【原因】说明没有安装 graphviz 。请参考2.2完成Graphviz安装。
【常见问题2】open cpu.prof: The system cannot find the file specified
【场景】运行命令,以便图形化界面输出。
go tool pprof -http=:8080 cpu.prof
【原因】辉哥在windows下遇到的问题,丁恒在MAC下并没有遇到。后来我分析,需要先输出.prof文件,然后使用图形化查看即可。 例如以下命令即可呈现CPU占用的图形化界面分析。
go tool pprof -http=:8080 C:\Users\dd\pprof\pprof.samples.cpu.005.pb.gz
6. go-torch火焰图生成工具
go-torch是Uber公司开源的一款针对Golang程序的火焰图生成工具,能收集 stack traces,并把它们整理成火焰图,直观地程序给开发人员。go-torch是基于使用BrendanGregg创建的火焰图工具生成直观的图像,很方便地分析Go的各个方法所占用的CPU的时间。 go-torch命令的帮助说明如下:
PS D:\jusanban\doc\50-编码实现\GO\src\pprofDemo> go-torch -h
Usage:
  D:\jusanban\doc\50-编码实现\GO\bin\go-torch.exe [options] [binary] <profile source>
pprof Options:
/u, /url:          Base URL of your Go program (default: http://localhost:8080)
/suffix:       URL path of pprof profile (default: /debug/pprof/profile)
/b, /binaryinput:  File path of previously saved binary profile. (binary profile is anything
accepted by https://golang.org/cmd/pprof)
/binaryname:   File path of the binary that the binaryinput is for, used for pprof inputs
/t, /seconds:      Number of seconds to profile for (default: 30)
/pprofArgs:    Extra arguments for pprof
Output Options:
/f, /file:         Output file name (must be .svg) (default: torch.svg)
/p, /print         Print the generated svg to stdout instead of writing to file
/r, /raw           Print the raw call graph output to stdout instead of creating a flame graph;
use with Brendan Gregg's flame graph perl script (see
https://github.com/brendangregg/FlameGraph)
/title:        Graph title to display in the output file (default: Flame Graph)
/width:        Generated graph width (default: 1200)
/hash          Colors are keyed by function name hash
/colors:       set color palette. choices are: hot (default), mem, io, wakeup, chain, java,
js, perl, red, green, blue, aqua, yellow, purple, orange
/cp            Use consistent palette (palette.map)
/reverse       Generate stack-reversed flame graph
/inverted      icicle graph
Help Options:
/?                 Show this help message
/h, /help          Show this help message
复制6.1 安装go-torch
WINDOWS命令行安装go-torch:
go get github.com/uber/go-torch
然后进入go-torch安装目录,安装FlameGraph。例如:
cd D:\jusanban\doc\50-编码实现\GO\src\github.com\uber\go-torch git clone https://github.com/brendangregg/FlameGraph.git
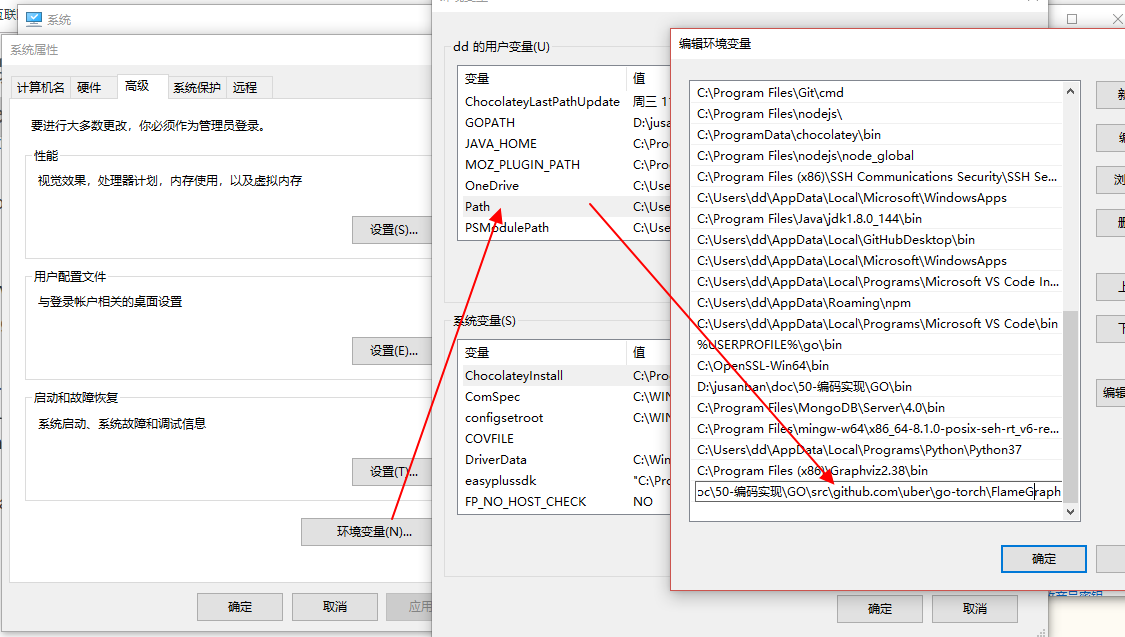
然后将FlameGraph路径添加到Path环境变量中。
D:\jusanban\doc\50-编码实现\GO\src\github.com\uber\go-torch\FlameGraph
6.2 下载安装 Perl ,用于执行 .pl 文件
要执行.pl文件,需要安装 Perl 语言的运行环境,windows 10 安装 ActivePerl。 从官网或者百度网盘直接下载源程序按照默认设置完成安装。 https://pan.baidu.com/s/107UTzX-9_vgFPTW93Ec3AA
检查是否按照成功
命令行输入perl -v即可检查是否已经安装成功。
perl -v
This is perl 5, version 26, subversion 3 (v5.26.3) built for MSWin32-x64-multi-thread
(with 2 registered patches, see perl -V for more detail)
Copyright 1987-2018, Larry Wall
Binary build 2603 [a95bce075] provided by ActiveState http://www.ActiveState.com
Built Dec 17 2018 09:46:45
Perl may be copied only under the terms of either the Artistic License or the
GNU General Public License, which may be found in the Perl 5 source kit.
Complete documentation for Perl, including FAQ lists, should be found on
this system using "man perl" or "perldoc perl".  If you have access to the
Internet, point your browser at http://www.perl.org/, the Perl Home Page.
PS D:\jusanban\doc<span class="token number" style="box-sizing: border-box; list-style: inherit; color: rgb(240, 141, 73);">50-编码实现<span class="token constant" style="box-sizing: border-box; list-style: inherit; color: rgb(248, 197, 85);">GO\src\github.com\uber\go-torch>
复制【常见问题3】0mFailed: could not generate flame graph
【问题现象】
go-torch -u http://localhost:6060 -t 30
?[34mINFO[16:11:20] ?[0mRun pprof command: go tool pprof -raw -seconds 30 http://localhost:6060/debug/pprof/profile
?[31mFATAL[16:11:54] ?[0mFailed: could not generate flame graph: Cannot find flamegraph scripts in the PATH or current directory. You can download the script at https://github.com/brendangregg/FlameGraph. These scripts should be added to your PATH or in the directory where go-torch is executed. Alternatively, you can run go-torch with the --raw flag.
复制【原因及解决方法】 生不出火焰图,原因为flamegraph.pl不是有效的可执行文件。在WINDOWS下,需要安装perl才能执行这个文件呢。
6.3 生成并分析火焰图
命令含输入
go-torch /u http://localhost:6060/debug/pprof/ /f cpu-local.svg
结果:
go-torch /u http://localhost:6060/debug/pprof/ /f cpu-local.svg
?[34mINFO[21:29:54] ?[0mRun pprof command: go tool pprof -raw -seconds 30 http://localhost:6060/debug/pprof/profile
?[34mINFO[21:30:26] ?[0mWriting svg to cpu-local.svg
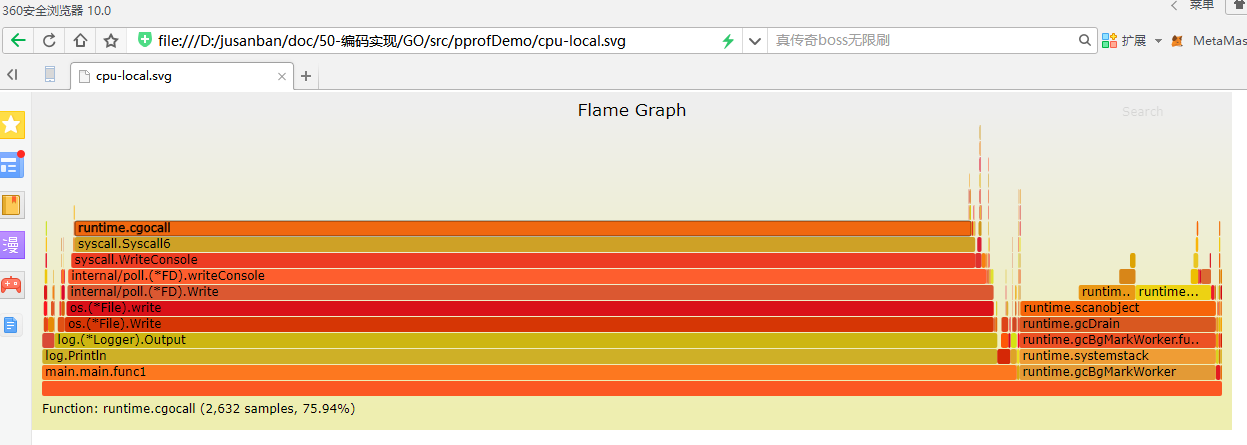
复制在浏览器下打开生成的cpu-local.svg文件,可以看到火焰图情况。
【火焰图分析】
y 轴表示调用栈,每一层都是一个函数。调用栈越深,火焰就越高,顶部就是正在执行的函数,下方都是它的父函数。
x 轴表示抽样数,如果一个函数在 x 轴占据的宽度越宽,就表示它被抽到的次数多,即执行的时间长。注意,x 轴不代表时间,而是所有的调用栈合并后,按字母顺序排列的。
火焰图就是看顶层的哪个函数占据的宽度最大。只要有"平顶"(plateaus),就表示该函数可能存在性能问题。
颜色没有特殊含义,因为火焰图表示的是 CPU 的繁忙程度,所以一般选择暖色调。
7. 高性能程序建议
以下是一些从其它项目借鉴或者自己总结的实践经验,它们只是建议,而不是准则,实际项目中应该以性能分析数据来作为优化的参考,避免过早优化。
- 对频繁分配的小对象,使用sync.Pool对象池避免分配
- 自动化的 DeepCopy 是非常耗时的,其中涉及到反射,内存分配,容器(如 map)扩展等,大概比手动拷贝慢一个数量级
- 用 atomic.Load/StoreXXX,atomic.Value, sync.Map 等代替 Mutex。(优先级递减)
- 使用高效的第三方库,如用fasthttp替代 net/http
- 在开发环境加上
-race编译选项进行竞态检查 - 在开发环境开启 net/http/pprof,方便实时 pprof
- 将所有外部IO(网络IO,磁盘IO)做成异步
8.参考
(1)Go学习之路-代码性能监控pprof https://www.jianshu.com/p/60c0c178212a 【点评】丁恒输出,有实践内容。
(2)gprof使用介绍 https://blog.csdn.net/linquidx/article/details/5916701
(3)go pprof 性能分析 https://juejin.im/entry/5ac9cf3a518825556534c76e
(4)Golang 大杀器之性能剖析 PProf https://segmentfault.com/a/1190000016412013
(5)golang pprof 实战 https://blog.wolfogre.com/posts/go-ppof-practice/ 【点评】整理得不错。
(6)使用pprof分析cpu占用过高问题 https://studygolang.com/articles/21841 【点评】CPU占用过高样例分析
(7)Golang性能测试工具PProf应用详解 https://studygolang.com/articles/19024?fr=sidebar
(8)windows下Graphviz安装及入门教程 https://blog.csdn.net/lanchunhui/article/details/49472949
(9)golang学习笔记-pprof性能分析1 https://blog.csdn.net/qq_30549833/article/details/89378933
(10)golang学习笔记-pprof性能分析2 https://blog.csdn.net/qq_30549833/article/details/89381790
(11)golang 使用pprof和go-torch做性能分析 -- Windows https://www.jianshu.com/p/a22174de24c7
(12)windows 10 下载安装 Perl ,用于执行 .pl 文件。 https://www.jianshu.com/p/e0d593217756
(13)如何读懂火焰图? http://www.ruanyifeng.com/blog/2017/09/flame-graph.html
(14)pprof & 火焰图go-torch https://blog.csdn.net/u014229215/article/details/88837767